
Gantt charts
Probably the most time-consuming to prepare, but most essential, is the project plan or time-line.
One of the most useful forms is called a Gantt Chart.
This sets out in visual form:
- All the tasks that must be completed during the project
- Any constraints on when tasks can be completed, such as which tasks must be completed before others can start, or particular deadlines
- The likely and maximum duration of each task
- The resources that will be dedicated to each task
- The critical path, or in scientific terms, the ‘rate-limiting steps’, the tasks that will define the length of the project because they cannot be shortened
A simple Gantt Chart looks something like this:
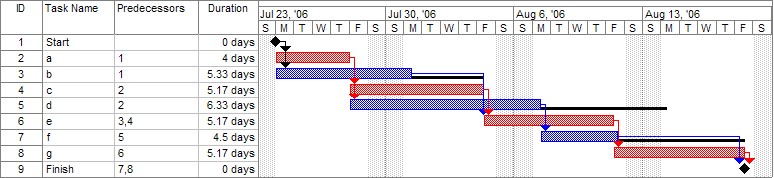
Because it shows linkages between tasks, such a diagram helps to prevent you from falling into the trap of the ‘miracle box’, as in ‘in this area, a miracle will happen which will move us from where we are to where we need to be’.
Warning – you need a lot of information to prepare a Gantt chart, some of which will be estimated.
The more you estimate, the less accurate it will be, and you may need to revisit your estimates several times before you agree a time-line with the project sponsor or Project Board.
If you make realistic estimates of the required time for each task, within the resource constraints, and your Gantt chart shows your project finishing three months after the desired end-date, you will probably need to renegotiate the deadlines.
This process is called ‘expectation management’ and, like good planning, will avoid problems later.
Your next task as project manager is to get the work started. If you have done the planning, this should be relatively straightforward as all those involved will know what they’re doing. You will only need to check periodically that all is going according to plan.